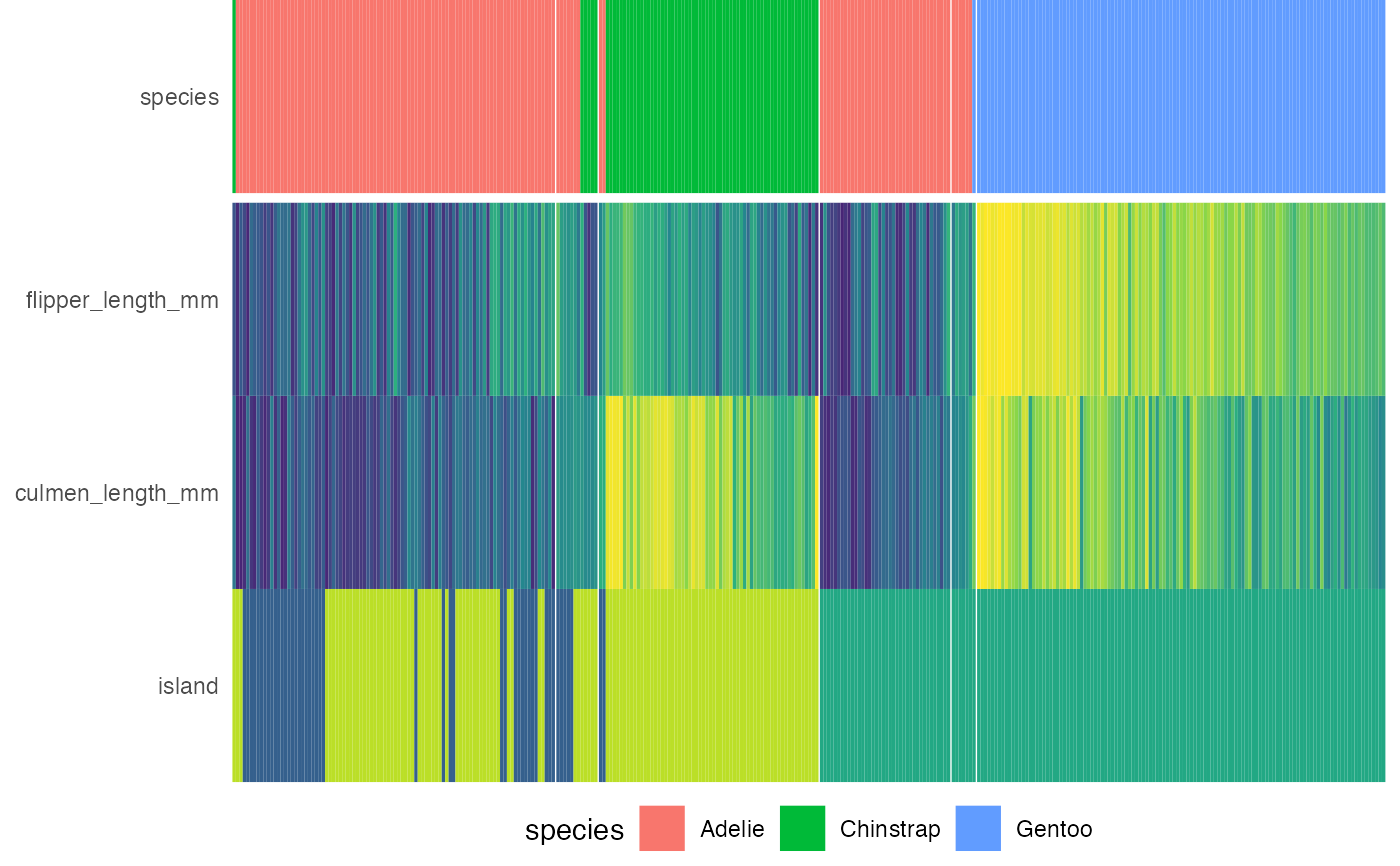
Draws the heatmap to be placed below the decision tree.
draw_heat(
  dat,
  fit,
  feat_types = NULL,
  target_cols = NULL,
  target_lab_disp = fit$target_lab,
  trans_type = c("percentize", "normalize", "scale", "none"),
  clust_feats = TRUE,
  feats = NULL,
  show_all_feats = FALSE,
  p_thres = 0.05,
  cont_legend = "none",
  cate_legend = "none",
  cont_cols = ggplot2::scale_fill_viridis_c,
  cate_cols = ggplot2::scale_fill_viridis_d,
  panel_space = 0.001,
  target_space = 0.05,
  target_pos = "top"
)
Arguments
- dat
Dataframe with samples from original dataset ordered according to the clustering within each leaf node.
- fit
party object, e.g., as output from partykit::ctree()
- feat_types
Named vector indicating the type of each features, e.g., c(sex = 'factor', age = 'numeric'). If feature types are not supplied, infer from column type.
- target_cols
Character vectors representing the hex values of different level colors for targets, defaults to viridis option B.
- target_lab_disp
Character string for displaying the label of target label. If not provided, use `target_lab`.
- trans_type
Character string of 'normalize', 'scale' or 'none'. If 'scale', subtract the mean and divide by the standard deviation. If 'normalize', i.e., max-min normalize, subtract the min and divide by the max. If 'none', no transformation is applied. More information on what transformation to choose can be acquired here: https://cran.rstudio.com/package=heatmaply/vignettes/heatmaply.html#data-transformation-scaling-normalize-and-percentize
- clust_feats
Logical. If TRUE, performs cluster on the features.
- feats
Character vector of feature names to be displayed in the heatmap. If NULL, display features of which P values are less than `p_thres`.
- show_all_feats
Logical. If TRUE, show all features regardless of `p_thres`.
- p_thres
Numeric value indicating the p-value threshold of feature importance. Feature with p-values computed from the decision tree below this value will be displayed on the heatmap.
- cont_legend
Function determining the options for legend of continuous variables, defaults to FALSE. If TRUE, use `guide_colorbar(barwidth = 10, barheight = 0.5, title = NULL)`. Any other [`guides()`](https://ggplot2.tidyverse.org/reference/guides.html) functions would also work.
- cate_legend
Function determining the options for legend of categorical variables, defaults to FALSE. If TRUE, use `guide_legend(title = NULL)`. Any other [`guides()`](https://ggplot2.tidyverse.org/reference/guides.html) functions would also work.
- cont_cols
Function determining color scale for continuous variable, defaults to `scale_fill_viridis_c(guide = cont_legend)`.
- cate_cols
Function determining color scale for nominal categorical variable, defaults to `scale_fill_viridis_d(begin = 0.3, end = 0.9)`.
- panel_space
Spacing between facets relative to viewport, recommended to range from 0.001 to 0.01.
- target_space
Numeric value indicating spacing between the target label and the rest of the features
- target_pos
Character string specifying the position of the target label on heatmap, can be 'top', 'bottom' or 'none'.
Value
A ggplot2 grob object of the heatmap.
Examples
x <- compute_tree(penguins, target_lab = 'species')
draw_heat(x$dat, x$fit)
#> Scale for 'y' is already present. Adding another scale for 'y', which will
#> replace the existing scale.
