heat_tree() alias.
heat_tree(
  x,
  target_lab = NULL,
  data_test = NULL,
  task = c("classification", "regression"),
  feat_types = NULL,
  label_map = NULL,
  target_cols = NULL,
  target_legend = FALSE,
  clust_samps = TRUE,
  clust_target = TRUE,
  custom_layout = NULL,
  show = "heat-tree",
  heat_rel_height = 0.2,
  lev_fac = 1.3,
  panel_space = 0.001,
  print_eval = (!is.null(data_test)),
  ...
)

treeheatr(
  x,
  target_lab = NULL,
  data_test = NULL,
  task = c("classification", "regression"),
  feat_types = NULL,
  label_map = NULL,
  target_cols = NULL,
  target_legend = FALSE,
  clust_samps = TRUE,
  clust_target = TRUE,
  custom_layout = NULL,
  show = "heat-tree",
  heat_rel_height = 0.2,
  lev_fac = 1.3,
  panel_space = 0.001,
  print_eval = (!is.null(data_test)),
  ...
)
Arguments
- x
Dataframe or a `party` or `partynode` object representing a custom tree. If a dataframe is supplied, conditional inference tree is computed. If a custom tree is supplied, it must follow the partykit syntax: https://cran.r-project.org/web/packages/partykit/vignettes/partykit.pdf
- target_lab
Name of the column in data that contains target/label information.
- data_test
Tidy test dataset. Required if `x` is a `partynode` object. If NULL, heatmap displays (training) data `x`.
- task
Character string indicating the type of problem, either 'classification' (categorical outcome) or 'regression' (continuous outcome).
- feat_types
Named vector indicating the type of each features, e.g., c(sex = 'factor', age = 'numeric'). If feature types are not supplied, infer from column type.
- label_map
Named vector of the meaning of the target values, e.g., c(`0` = 'Edible', `1` = 'Poisonous').
- target_cols
Character vectors representing the hex values of different level colors for targets, defaults to viridis option B.
- target_legend
Logical. If TRUE, target legend is drawn.
- clust_samps
Logical. If TRUE, hierarchical clustering would be performed among samples within each leaf node.
- clust_target
Logical. If TRUE, target/label is included in hierarchical clustering of samples within each leaf node and might yield a more interpretable heatmap.
- custom_layout
Dataframe with 3 columns: id, x and y for manually input custom layout.
- show
Character string indicating which components of the decision tree-heatmap should be drawn. Can be 'heat-tree', 'heat-only' or 'tree-only'.
- heat_rel_height
Relative height of heatmap compared to whole figure (with tree).
- lev_fac
Relative weight of child node positions according to their levels, commonly ranges from 1 to 1.5. 1 for parent node perfectly in the middle of child nodes.
- panel_space
Spacing between facets relative to viewport, recommended to range from 0.001 to 0.01.
- print_eval
Logical. If TRUE, print evaluation of the tree performance. Defaults to TRUE when `data_test` is supplied.
- ...
Further arguments passed to `draw_tree()` and/or `draw_heat()`.
Value
A gtable/grob object of the decision tree (top) and heatmap (bottom).
Examples
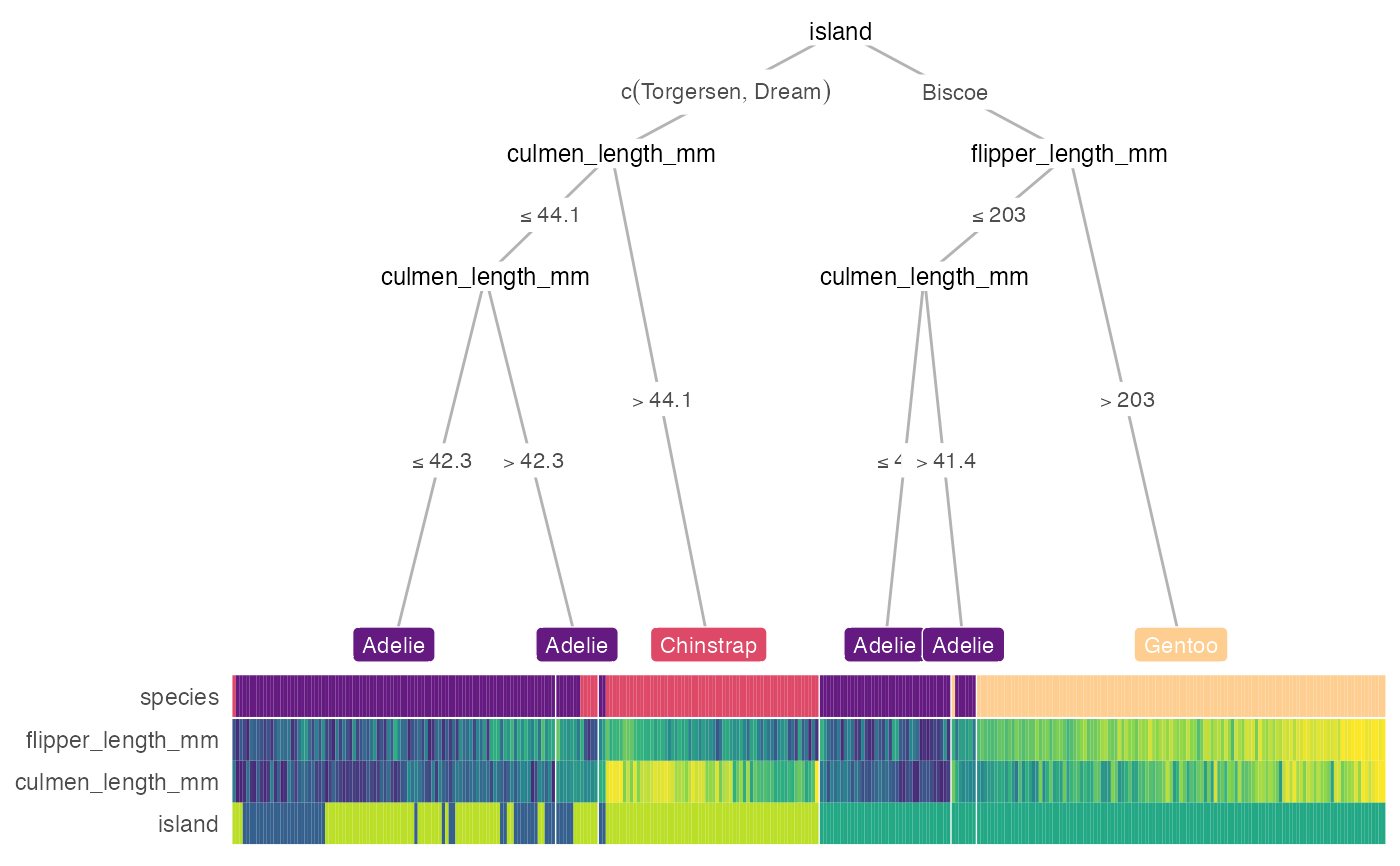
heat_tree(penguins, target_lab = 'species')
 # \donttest{
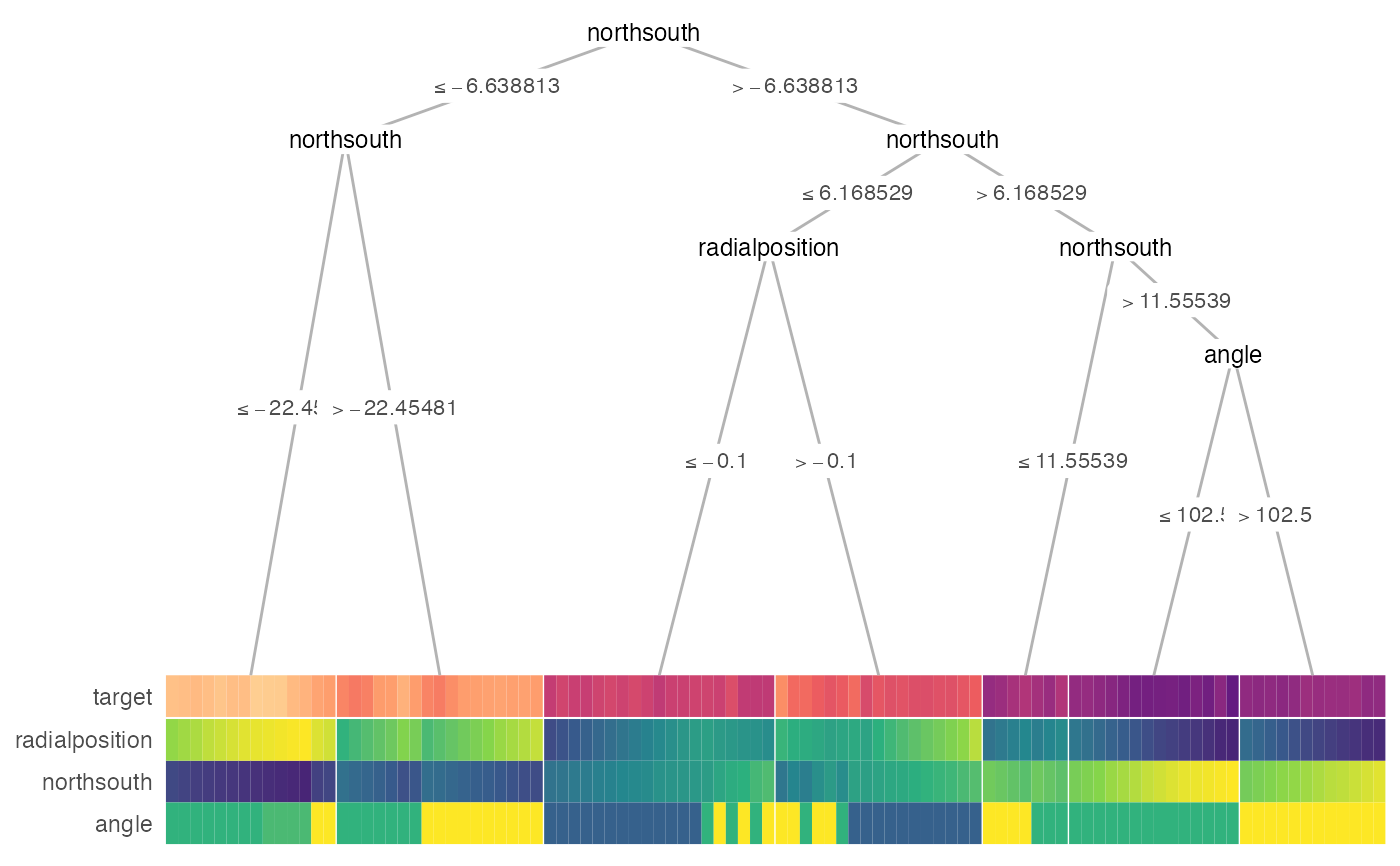
heat_tree(
x = galaxy[1:100, ],
target_lab = 'target',
task = 'regression',
terminal_vars = NULL,
tree_space_bottom = 0)
#> Warning: binary variable(s) 4 treated as interval scaled
# \donttest{
heat_tree(
x = galaxy[1:100, ],
target_lab = 'target',
task = 'regression',
terminal_vars = NULL,
tree_space_bottom = 0)
#> Warning: binary variable(s) 4 treated as interval scaled
 # }
treeheatr(penguins, target_lab = 'species')
# }
treeheatr(penguins, target_lab = 'species')
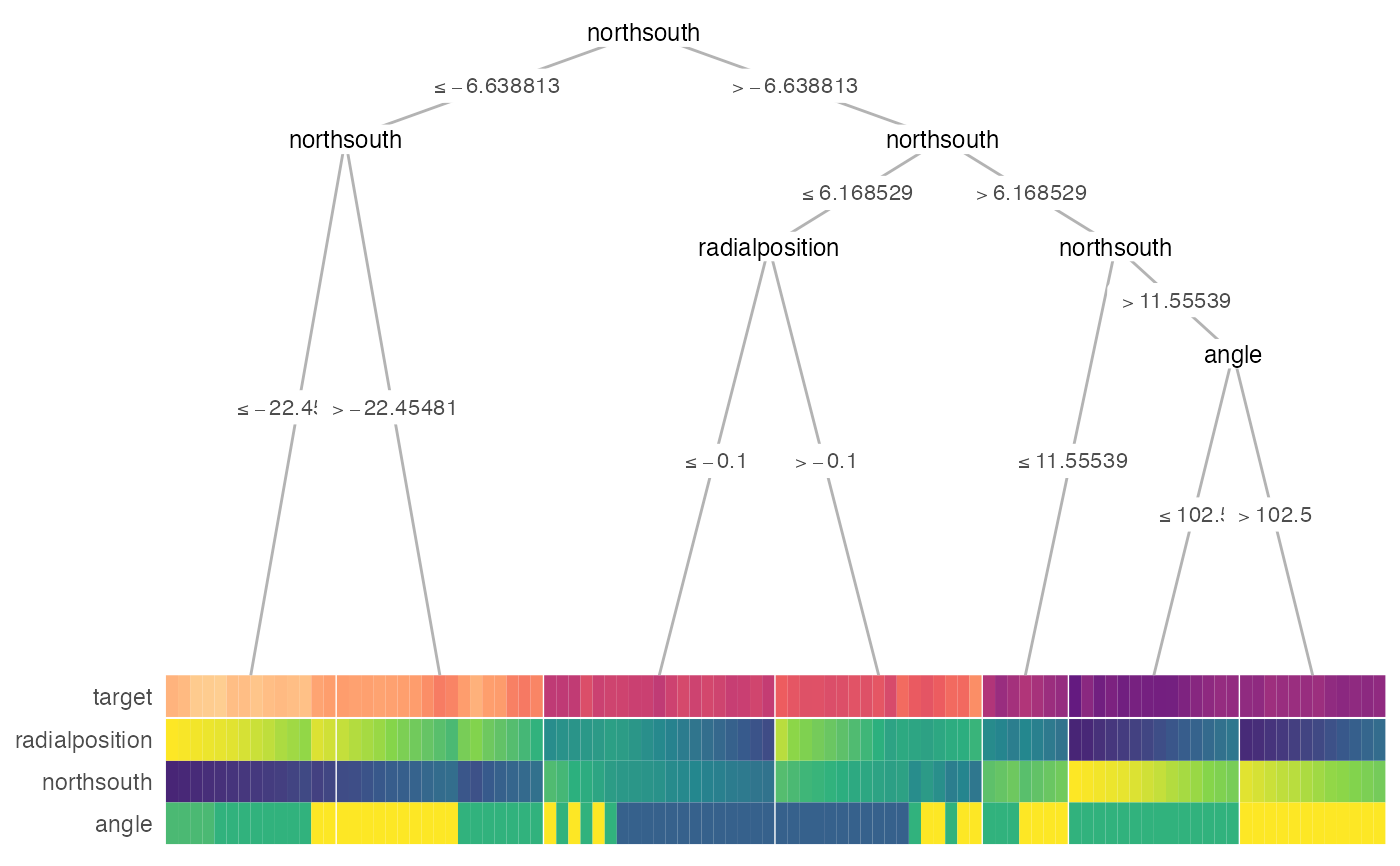
 treeheatr(
x = galaxy[1:100, ],
target_lab = 'target',
task = 'regression',
terminal_vars = NULL,
tree_space_bottom = 0)
#> Warning: binary variable(s) 4 treated as interval scaled
treeheatr(
x = galaxy[1:100, ],
target_lab = 'target',
task = 'regression',
terminal_vars = NULL,
tree_space_bottom = 0)
#> Warning: binary variable(s) 4 treated as interval scaled